
System Monitoring
Use the eEVOS monitoring functions to check individual systems and clusters during daily operation. The built-in dashboards provide a quick overview. Prometheus, the REST API, and Ansible support detailed queries and centralized monitoring of multiple installations.
Monitoring options at a glance
| Method | Best suited for | Access |
|---|---|---|
| eEVOS dashboards | Daily checks and charts | Normal GUI login |
| Prometheus | Metrics, capacity analysis, and PromQL | https://<eevos-address>/prometheus/ after GUI login |
| REST API | Structured health, inventory, and job data | API key via https://<eevos-address>:18443/api/v1/ |
| Ansible | Repeatable checks across several systems | Separate control node using SSH or the REST API |
| Alerts | Proactive notification of service and capacity problems | Configured notification channel |
Use the built-in web monitoring
- Sign in to the eEVOS administration interface.
- Open Statistics.
- Select IO Stats, VM Statistics, or Ceph Stats.
- Choose a time range and compare all cluster nodes.
- Investigate sustained high values, clear deviations, missing series, and unexpected zero values.
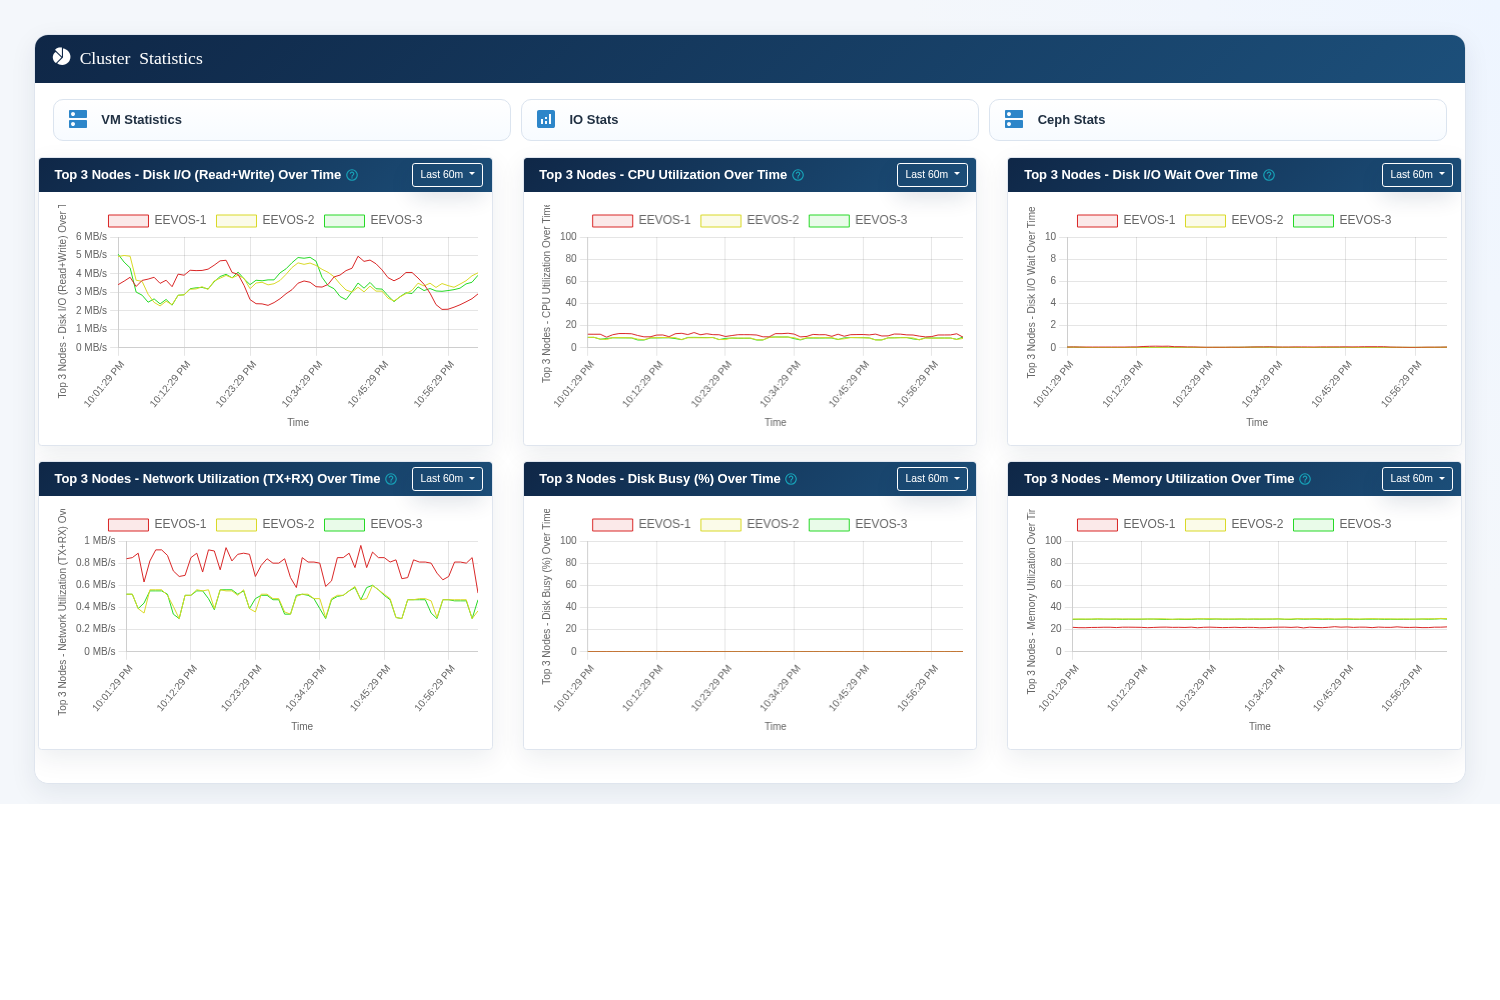
The system dashboard provides a quick view of health and utilization.
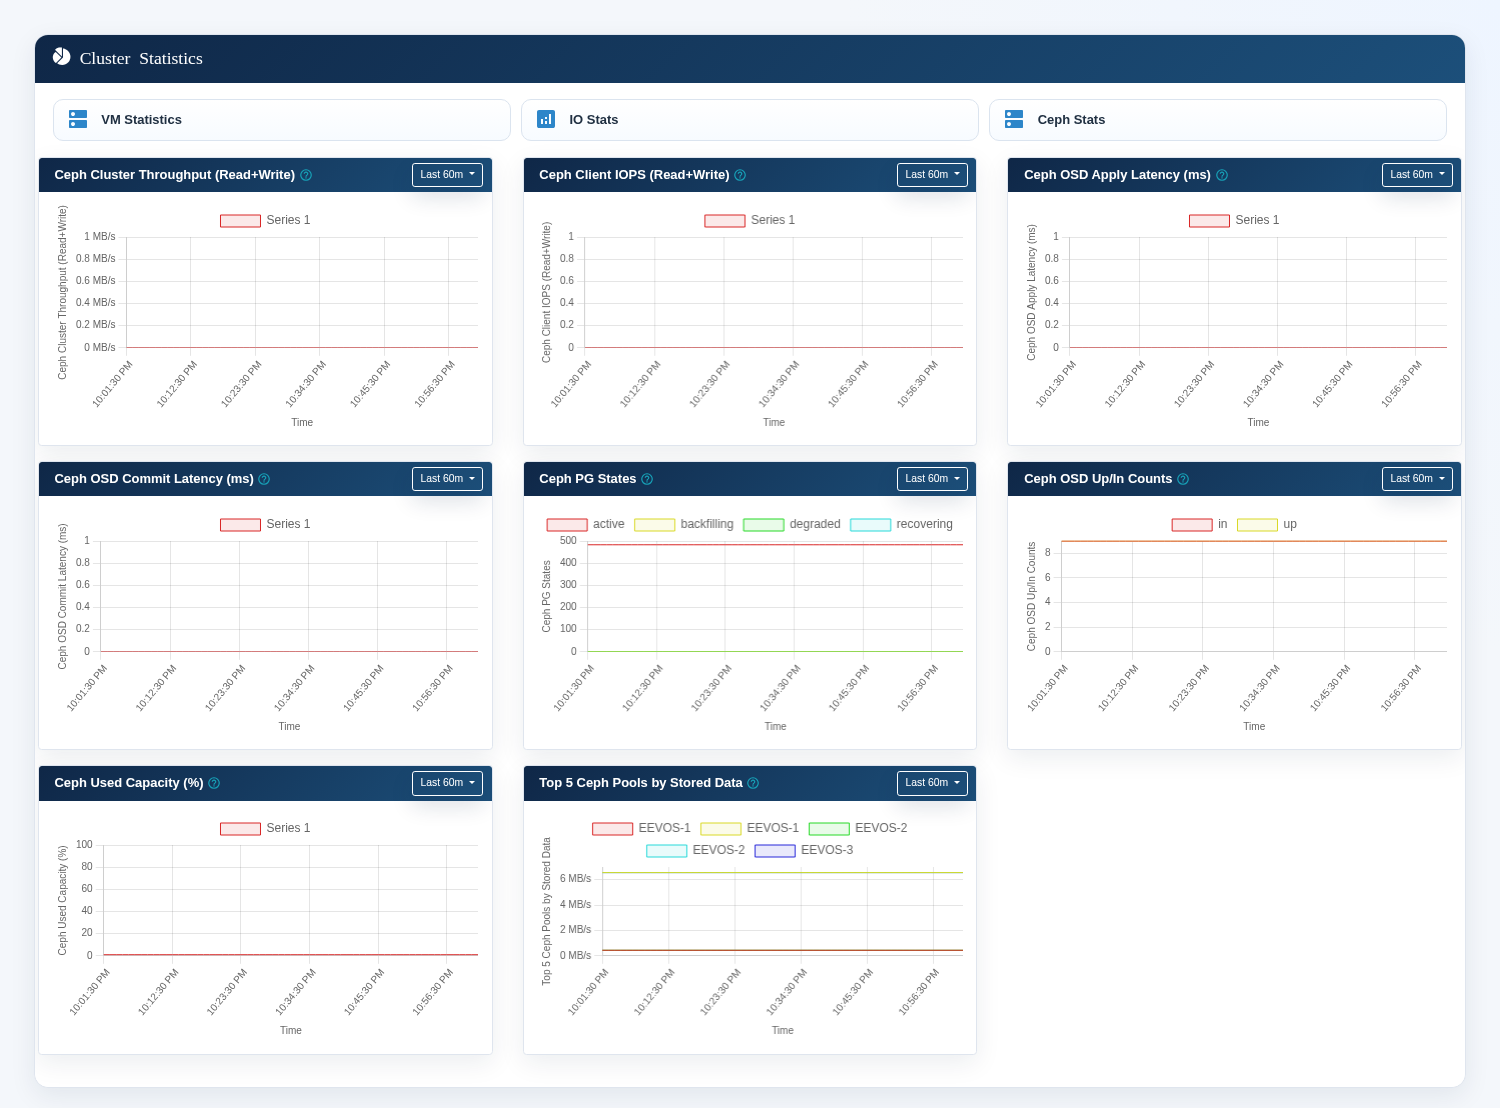
| Area | What to look for |
|---|---|
| CPU and load | Sustained utilization, sudden changes, or one node carrying more load than the others. |
| Memory | Low available memory, increasing use, or differences between nodes. |
| Storage and network | High I/O wait, continuously saturated links, or inactive interfaces. |
| Virtual machines | CPU, memory, block-I/O, and network behavior for individual VMs. |
| Ceph | OSDs that are not up/in, degraded placement groups, recovery activity, latency, and capacity. |
Use Prometheus
Prometheus collects time-series data from system, VM, and Ceph exporters. Open Prometheus through the eEVOS proxy. Do not expose the local Prometheus port directly to an untrusted network.
- Sign in to the eEVOS interface.
- In the same browser, open
https://<eevos-address>/prometheus/. - Use Query for metrics, Alerts for active alerts, and Status → Targets for exporter health.
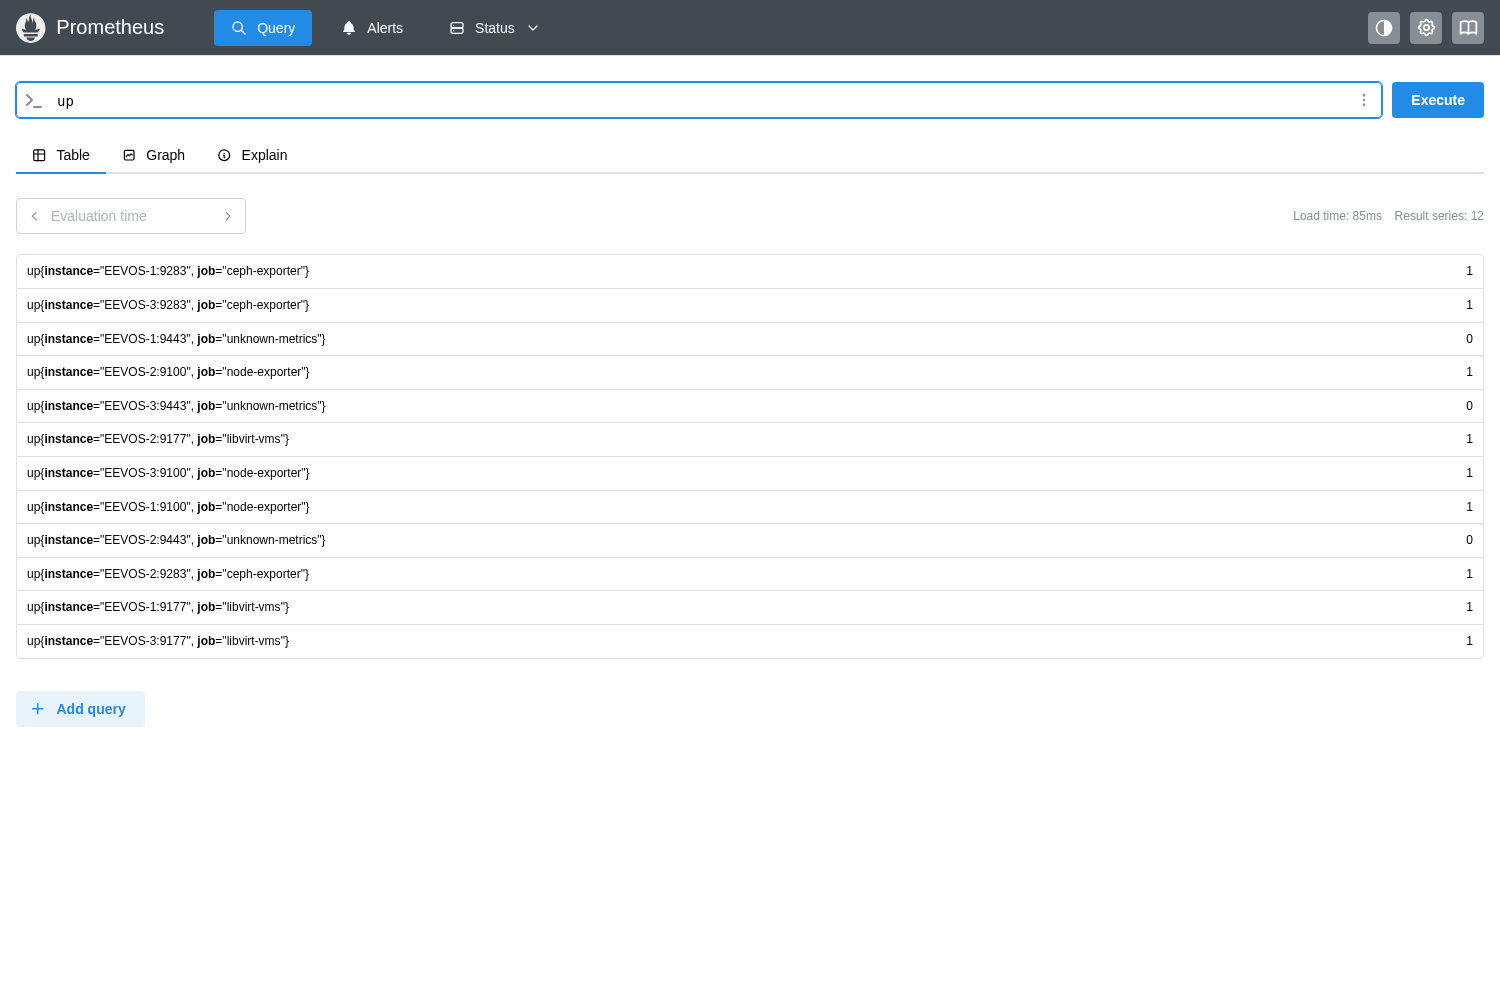
Useful Prometheus queries
| Purpose | PromQL |
|---|---|
| Exporter availability | up |
| System load | node_load1 |
| Available memory percentage | 100 * node_memory_MemAvailable_bytes / node_memory_MemTotal_bytes |
| Non-idle CPU usage | 100 * (1 - avg by(instance) (rate(node_cpu_seconds_total{mode="idle"}[5m]))) |
| Ceph OSD health | ceph_osd_up |
| Used Ceph capacity | ceph_cluster_used_bytes |
Metric names can differ between editions and exporter versions. Use the metric search to confirm the names available on your system.
Configure the REST API for monitoring
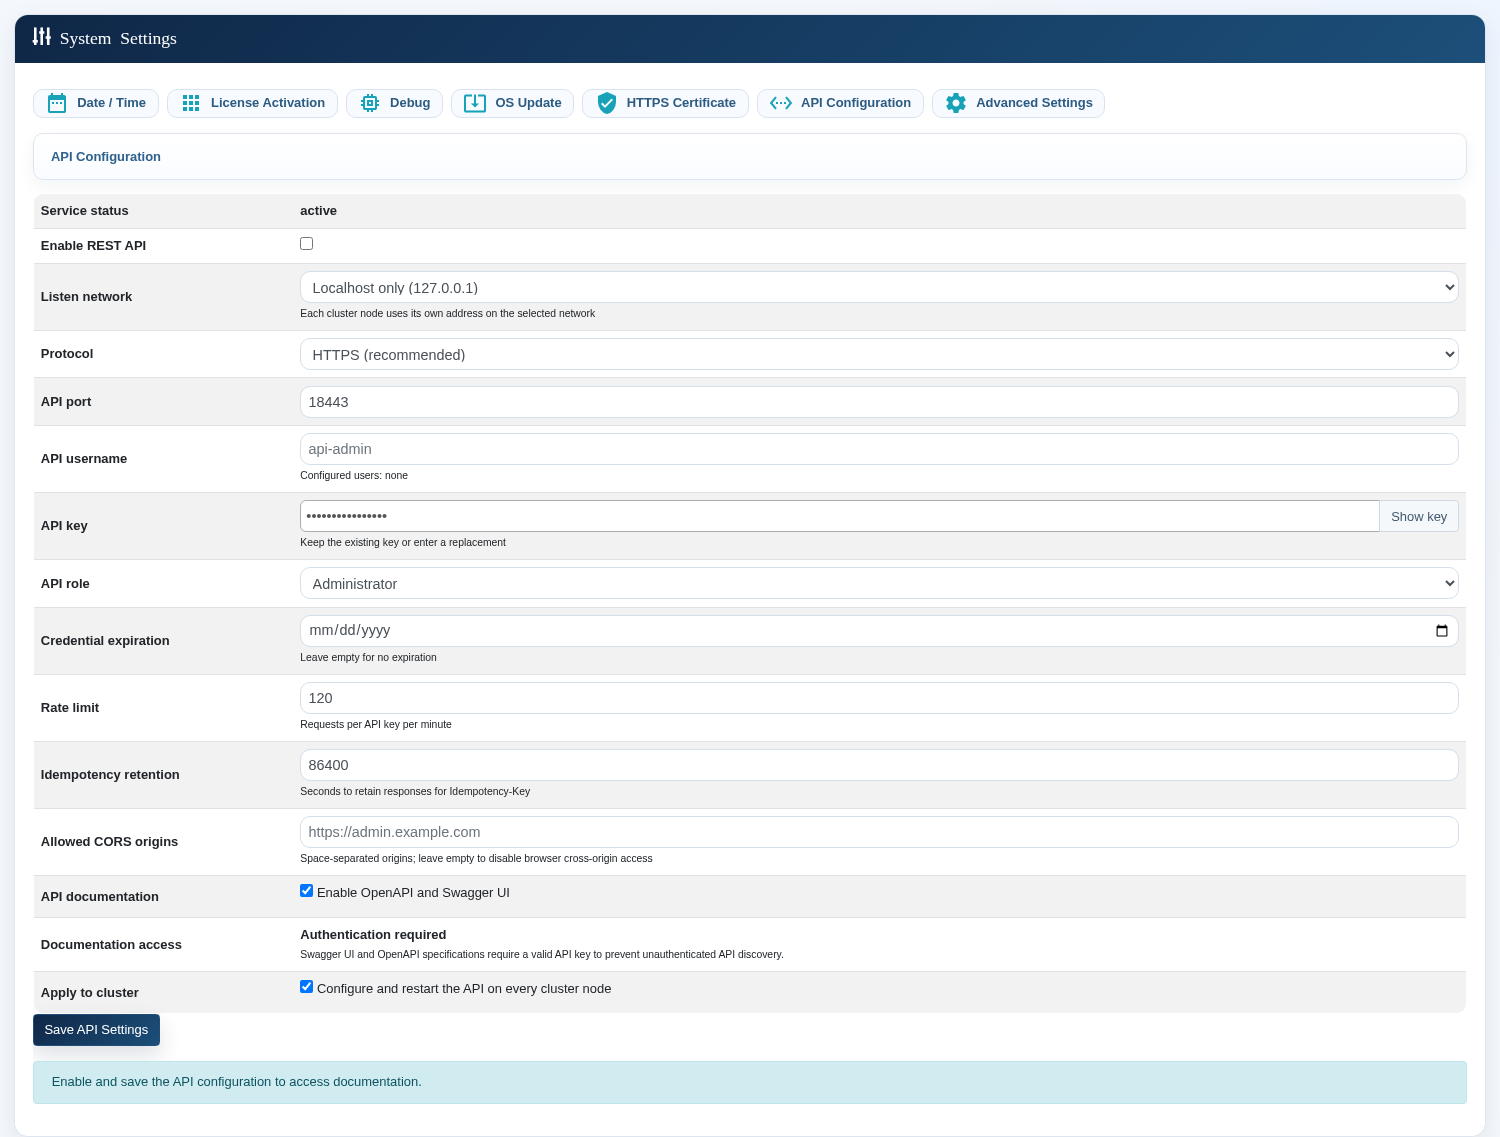
- Open System Settings → API Configuration.
- Enable external REST API access.
- Select a reachable management network. Localhost only cannot be reached remotely.
- Use HTTPS and the default port
18443. - Create a dedicated API user with a strong key and the minimum required permissions.
- Save the settings and test the health endpoint from the monitoring host.
Basic API test
export EEVOS_URL="https://<eevos-address>:18443"
export EEVOS_API_KEY="<api-key>"
curl --fail --silent --show-error   -H "X-API-Key: $EEVOS_API_KEY"   "$EEVOS_URL/health"
Useful endpoints include /health, /cluster, /nodes, /vms, /storage, and /jobs. Confirm the endpoints available in your installed version before building permanent checks.
Monitor with Ansible
Use Ansible when the same health checks must run across several eEVOS systems. Keep the inventory and playbooks on a dedicated control node.
- Add the management addresses to an inventory group.
- Use SSH modules for operating-system checks or
ansible.builtin.urifor REST API checks. - Store API keys in Ansible Vault or another secrets manager.
- Fail the play when a required service, target, node, or storage component is unhealthy.
- Run the play manually, from a scheduler, or from your monitoring platform.
Alerts and check intervals
| Check | Suggested interval |
|---|---|
| Node, exporter, and API availability | Every 1–5 minutes |
| Ceph health and storage faults | Every 1–5 minutes |
| VM and job status | Every 5–15 minutes |
| Capacity trend | Hourly or daily |
Troubleshooting
| Problem | Check and action |
|---|---|
| Prometheus redirects to the login page | Sign in to the GUI first and open the proxy in the same browser. |
A target is down |
Check Status → Targets, lastError, the node, exporter service, DNS, and firewall. |
| A dashboard contains gaps | Check Prometheus readiness, target health, time synchronization, and service logs. |
| REST works only locally | Check the listening network, firewall, routing, and external API access. |
| REST returns 401 or 403 | Check the API key, role, expiry, and key rotation. |
| REST returns 429 | Reduce the request frequency. |
Daily checklist
- All expected Prometheus targets report
up. - All nodes provide current system data.
- Ceph OSDs and placement groups are healthy.
- No unexpected critical alerts remain open.
- REST
/healthresponds and credentials are not close to expiry. - Jobs do not remain in
runningstate indefinitely. - VM placement and balancing match expectations.
- Capacity leaves enough reserve for failures and maintenance.
Security
Use the GUI session cookie only for the Prometheus proxy and a dedicated API key for REST. Restrict access to management networks, validate TLS certificates, and rotate credentials regularly. Do not publish Prometheus, exporters, or the REST API directly to untrusted networks.
Query terminology
PromQL is the Prometheus Query Language. Use it to select, filter, and calculate time-series metrics in Prometheus-compatible dashboards and API queries.