
Ceph Status Details, OSDs and Placement Groups
The Cluster Status area exposes detailed Ceph status information that is useful for operations and troubleshooting. The live eEKAS R8 interface includes tabs for Ceph Status, Monitors, Managers, MDS, Objects / PGs and MON/MGR Placement.
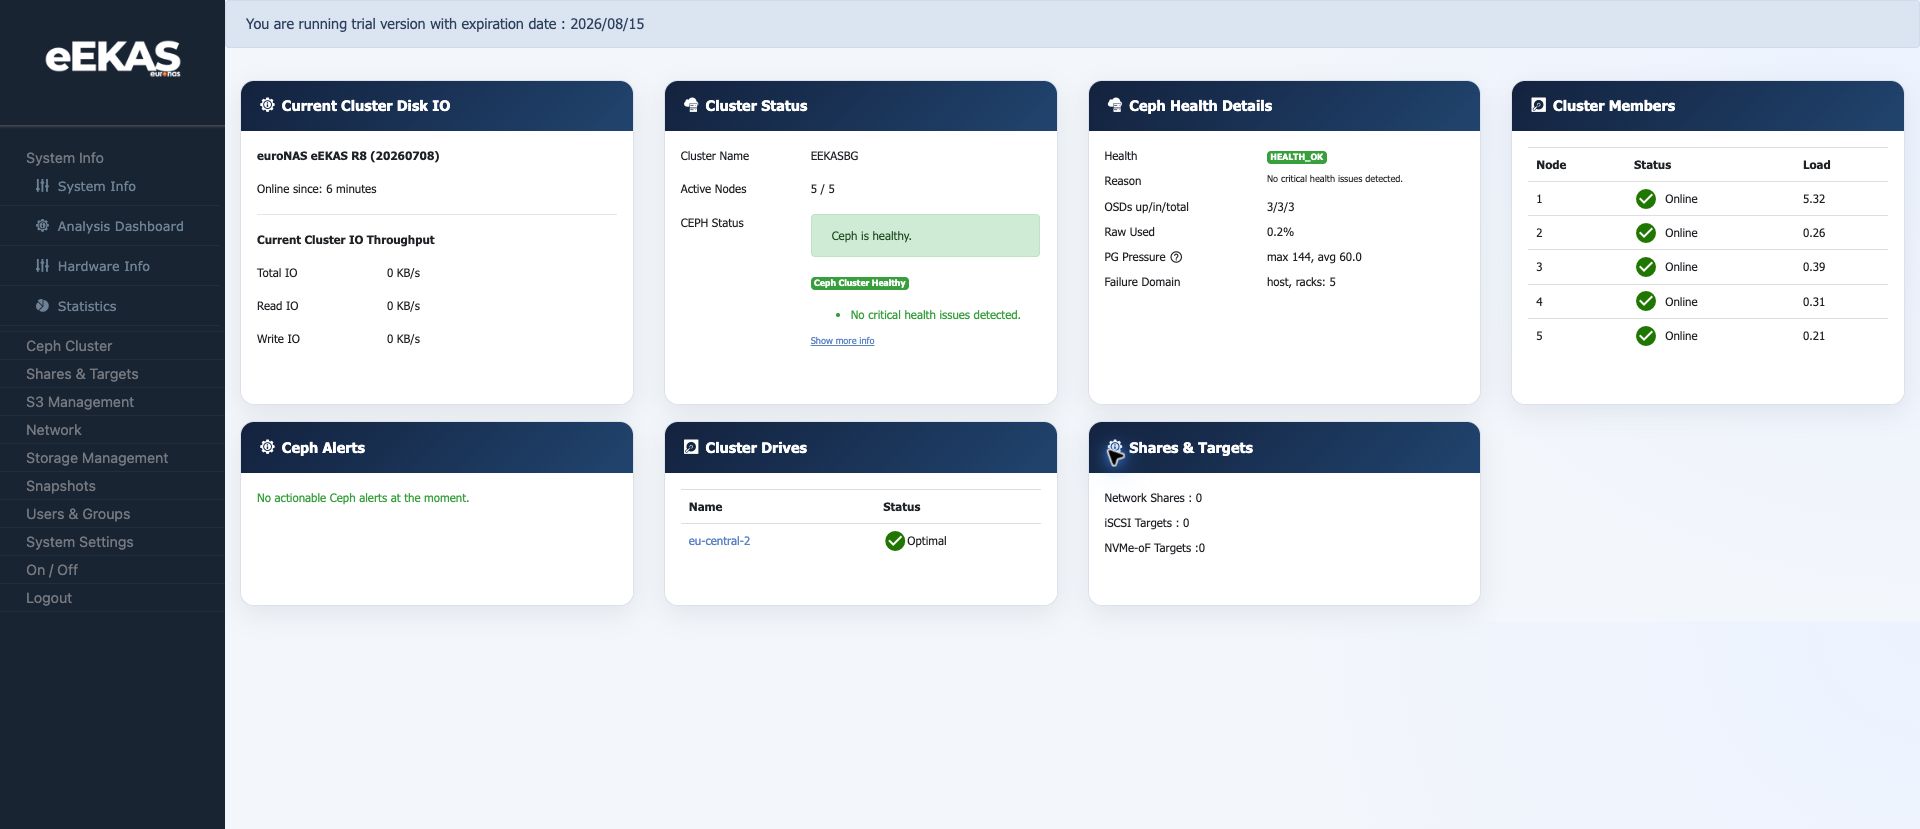
Key Health Fields
| Field | Meaning |
|---|---|
| Health | Overall Ceph health state. HEALTH_OK means no critical health issue is currently reported. |
| Reason | Short explanation of the current health state. |
| OSDs up/in/total | Shows how many OSDs are running, part of the cluster and known in total. |
| Raw Used | Percentage of raw cluster capacity currently used. |
| PG Pressure | Placement group pressure indicator. The dashboard can show maximum and average values. |
| Failure Domain | The failure boundary used for data placement, for example host. |
OSD Interpretation
OSDs are the storage daemons that store object data. A healthy production state normally requires the expected OSDs to be both up and in. If an OSD is down or out, the cluster may still serve data, but redundancy and recovery state must be checked before additional changes are made.
Placement Groups
Placement groups distribute data across OSDs. The Objects / PGs view helps administrators understand object distribution, PG counts and pressure. High or uneven PG pressure can indicate that capacity, placement or recovery behaviour should be reviewed.
Recommended Troubleshooting Flow
- Start with the dashboard health summary.
- Open Cluster Status and review Ceph Status.
- Check OSDs up/in/total and raw usage.
- Review Objects / PGs when performance, balancing or recovery behaviour looks unusual.
- Record the health state and the exact warning text before taking corrective action.
Good Practice
Do not perform large configuration changes during an unhealthy state unless the change is part of the recovery plan. First document the current status, then decide whether the issue is node, disk, network, capacity or placement related.